How To Measure Share of Search
Matt Bell-Watson • 30 September 2020
The concept of Share of Search isn’t new, but it is getting a lot of attention lately. More brands are looking at how to use it to complement other metrics like Share of Voice. While others are exploring how search presence translates into sales and market share.
Since Mark Ritson wrote about it in Marketing Week, we’ve been getting lots of questions about it. In today’s post, we’ll share our perspective on Share of Search. We’ll explain how to measure impact, optimise activity and increase visibility and sales.
What Is Share of Search?

Share of Search is a way of measuring brand visibility within organic search results. It allows brands to benchmark the percentage of relevant searches they feature in. It’s useful for tracking how PR, marketing and SEO activity impact search visibility.
As search can signal intent, the theory is that Share of Search can predict future market share. If Share of Search increases, it may suggest that market share is likely to grow too.
But there are rarely simple answers to complex questions. It’s important to consider other metrics. For instance, a brand may have a higher share of search but a lower conversion rate than competitors. While other factors like price, reputation and trust are all at play.
How To Measure Share of Search
There are several methodologies used to calculate Share of Search. In this post, we’ll look at three of the more common approaches. For each method, we’ll use Asana, Monday.com and Trello as example brands. Each of these companies is likely to be competing for a share of similar searches in Google. These may include keywords such as ‘project management app’ or ‘task management’.
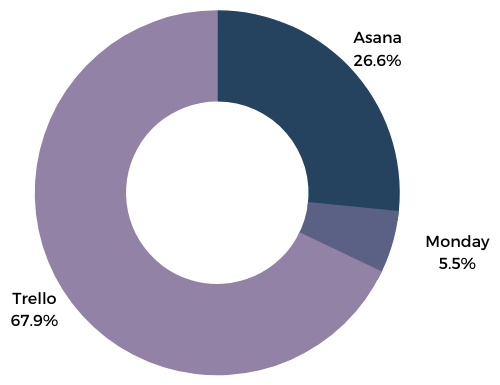
The Google Trends Method
This is one of the simpler methodologies, but it still has its uses as a measure of brand awareness. It compares the popularity of branded terms (e.g. Trello) against competitors. But it is not very comprehensive. It’s not possible to compare visibility within unbranded searches (e.g. task management). While no data is available for the volume of searches that keywords receive.
If you’re not familiar with Google Trends, it’s a free tool that gives you access to data on search trends. It provides an index rating of 0-100 for how popular search terms are. In isolation, this can help pinpoint the moments when a keyword or brand name was most searched for. There are filters by region, time or search type (e.g. YouTube).
You can compare each keyword or brand name against four others. In this case, the search volumes within this group inform the index rating. A comparison of brand searches can reveal brand visibility at a specific point or over a period (e.g. 12 months).
It’s also a smart way to identify seasonal spikes in demand or searches that are growing in importance. As we blogged about recently, trending search data can be used to inform and optimise content.
Share of Branded Search
(e.g. Trello)
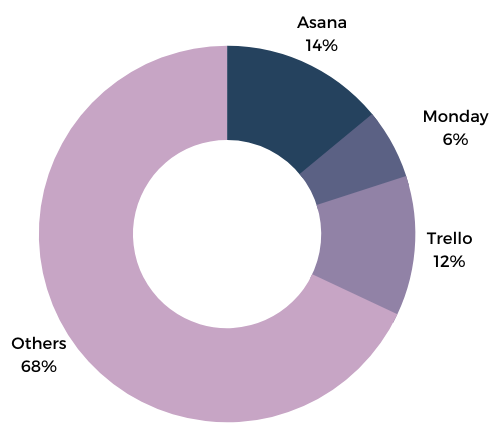
The Rankings Method
This is another simple method to measure visibility within search. The main advantage is that brands can analyse visibility within unbranded searches. For example, keywords like ‘project management app’ rather than branded terms like ‘Asana’. But, it’s a bit of a blunt instrument and delivers no insight into the audience size reached through search.
Within a set of keyword searches, Google will link to lots of different websites. This method looks at how many times Google links to each website within that set.
So, if we look at the top ten results for five keywords, we will have a sample of 50 links. Those websites may link to as many as 50 different websites. But in most cases, there will be several links to a few of the same websites. If there are five links to one website, we can assign that website a 10 per cent share of those searches.
It’s a smart way to find out who you are competing with on search. The websites with the greatest footprint in relevant searches might surprise you. But, as we all know, location is everything. Many people click on the first result they see on Google. Yet, this approach gives equal weighting to websites, regardless of where they rank. So, a website that ranks #1 for five searches would have a smaller share than a website that ranks #10 for six searches.
Share of Unbranded Search
(e.g. Project Management App)
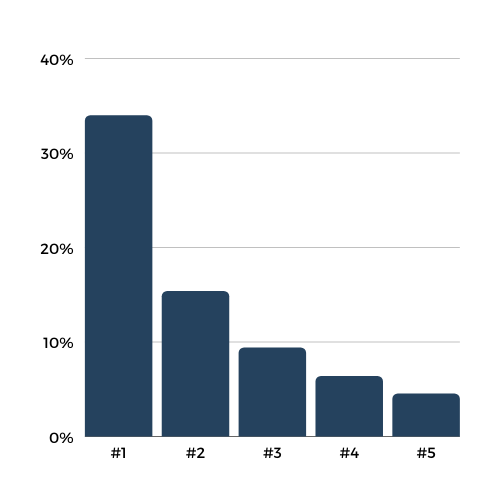
The Clicks Method
This is one of the smarter approaches for measuring Share of Search. It can estimate the potential share of traffic resulting from a set of keyword rankings.
This method combines two data points. It multiplies the average monthly searches for keywords with average click-through rates. You can estimate the total clicks a link may generate when included in results for a set of keywords.
As an example, we know that the first result shown in Google is typically clicked on by 34 per cent of UK desktop users. We also know that there is an average of 260 searches per month in the UK for ‘project management app’. If we multiply 260 by 34 per cent we get 88.4. This tells us that a #1 ranking for ‘property management app’ may generate around 88 site visits per month in the UK.
Brands can use this method at scale to measure visibility within lots of keywords. This gives brands the ability to see how slight changes in Google can impact website traffic. For businesses that are reliant on organic search to drive sales, this can be valuable intel to have.
Average Desktop CTR for Top 5 Organic Search Results in the UK in August 2020
(Source: Advanced Web Ranking)
How To Grow Sales Using Share of Search
We can make even smarter use of this data. By grouping searches together, we can measure Share of Search in the customer journey. In the early stages, people often look for solutions to problems. For instance, managing lots of different project timelines.
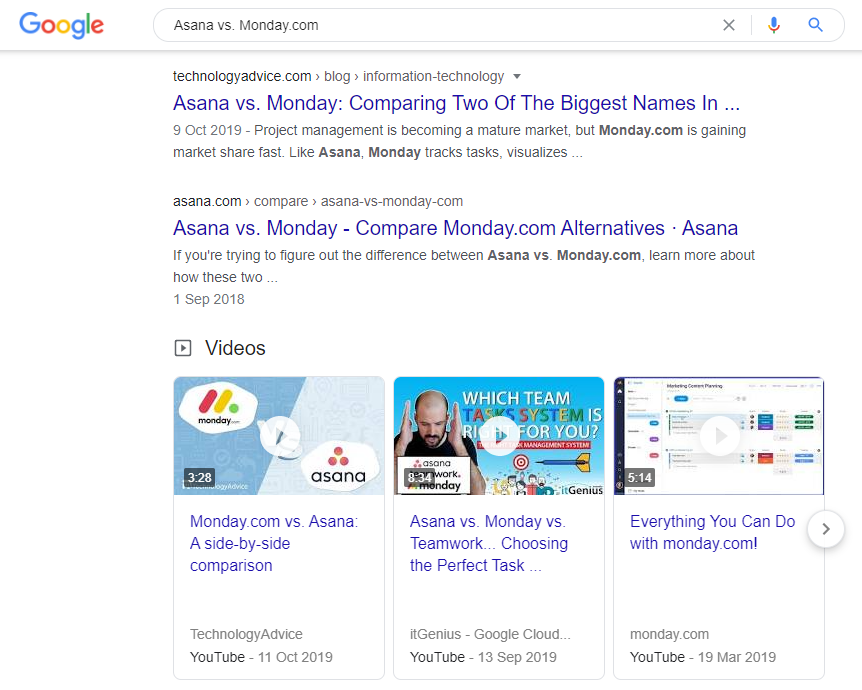
At later stages, people often look for reviews or recommendations. Searches like ‘Asana vs. Monday.com’ are common. Potential buyers often look for guidance and information to help them choose what to buy.
Analysing Share of Search in this way is smart as it helps identify issues as part of the customer journey. For instance, a brand could have a large Share of Search in the consideration stage. But it could have a much smaller Share of Search in the decision-making stage. This could impact sales.
Search can only tell you about part of the customer journey. Brands can expand their understanding by analysing conversations on social media as well. This can provide real insights into barriers and drivers for potential buyers. As well as identifying areas to improve, it can help to prove the impact of PR and marketing activity.
Example of a Search in the Decision-Making Stage of the Customer Journey
How To Measure Share of Search
Matt Bell-Watson • 30 September 2020
The concept of Share of Search isn’t new, but it is getting a lot of attention lately. More brands are looking at how to use it to complement other metrics like Share of Voice. While others are exploring how search presence translates into sales and market share.
Since Mark Ritson wrote about it in Marketing Week, we’ve been getting lots of questions about it. In today’s post, we’ll share our perspective on Share of Search. We’ll explain how to measure impact, optimise activity and increase visibility and sales.
What Is Share of Search?
Share of Search is a way of measuring brand visibility within organic search results. It allows brands to benchmark the percentage of relevant searches they feature in. It’s useful for tracking how PR, marketing and SEO activity impact search visibility.
As search can signal intent, the theory is that Share of Search can predict future market share. If Share of Search increases, it may suggest that market share is likely to grow too.
But there are rarely simple answers to complex questions. It’s important to consider other metrics. For instance, a brand may have a higher share of search but a lower conversion rate than competitors. While other factors like price, reputation and trust are all at play.
How To Measure Share of Search
There are several methodologies used to calculate Share of Search. In this post, we’ll look at three of the more common approaches. For each method, we’ll use Asana, Monday.com and Trello as example brands. Each of these companies is likely to be competing for a share of similar searches in Google. These may include keywords such as ‘project management app’ or ‘task management’.
The Google Trends Method
This is one of the simpler methodologies, but it still has its uses as a measure of brand awareness. It compares the popularity of branded terms (e.g. Trello) against competitors. But it is not very comprehensive. It’s not possible to compare visibility within unbranded searches (e.g. task management). While no data is available for the volume of searches that keywords receive.
If you’re not familiar with Google Trends, it’s a free tool that gives you access to data on search trends. It provides an index rating of 0-100 for how popular search terms are. In isolation, this can help pinpoint the moments when a keyword or brand name was most searched for. There are filters by region, time or search type (e.g. YouTube).
You can compare each keyword or brand name against four others. In this case, the search volumes within this group inform the index rating. A comparison of brand searches can reveal brand visibility at a specific point or over a period (e.g. 12 months).
It’s also a smart way to identify seasonal spikes in demand or searches that are growing in importance. As we blogged about recently, trending search data can be used to inform and optimise content.
Share of Branded Search
(e.g. Trello)
The Rankings Method
This is another simple method to measure visibility within search. The main advantage is that brands can analyse visibility within unbranded searches. For example, keywords like ‘project management app’ rather than branded terms like ‘Asana’. But, it’s a bit of a blunt instrument and delivers no insight into the audience size reached through search.
Within a set of keyword searches, Google will link to lots of different websites. This method looks at how many times Google links to each website within that set.
So, if we look at the top ten results for five keywords, we will have a sample of 50 links. Those websites may link to as many as 50 different websites. But in most cases, there will be several links to a few of the same websites. If there are five links to one website, we can assign that website a 10 per cent share of those searches.
It’s a smart way to find out who you are competing with on search. The websites with the greatest footprint in relevant searches might surprise you. But, as we all know, location is everything. Many people click on the first result they see on Google. Yet, this approach gives equal weighting to websites, regardless of where they rank. So, a website that ranks #1 for five searches would have a smaller share than a website that ranks #10 for six searches.
Share of Unbranded Search
(e.g. Project Management App)
The Clicks Method
This is one of the smarter approaches for measuring Share of Search. It can estimate the potential share of traffic resulting from a set of keyword rankings.
This method combines two data points. It multiplies the average monthly searches for keywords with average click-through rates. You can estimate the total clicks a link may generate when included in results for a set of keywords.
As an example, we know that the first result shown in Google is typically clicked on by 34 per cent of UK desktop users. We also know that there is an average of 260 searches per month in the UK for ‘project management app’. If we multiply 260 by 34 per cent we get 88.4. This tells us that a #1 ranking for ‘property management app’ may generate around 88 site visits per month in the UK.
Brands can use this method at scale to measure visibility within lots of keywords. This gives brands the ability to see how slight changes in Google can impact website traffic. For businesses that are reliant on organic search to drive sales, this can be valuable intel to have.
Average Desktop CTR for Top 5 Organic Search Results in the UK in August 2020
(Source: Advanced Web Ranking)
How To Grow Sales Using Share of Search
We can make even smarter use of this data. By grouping searches together, we can measure Share of Search in the customer journey. In the early stages, people often look for solutions to problems. For instance, managing lots of different project timelines.
At later stages, people often look for reviews or recommendations. Searches like ‘Asana vs. Monday.com’ are common. Potential buyers often look for guidance and information to help them choose what to buy.
Analysing Share of Search in this way is smart as it helps identify issues as part of the customer journey. For instance, a brand could have a large Share of Search in the consideration stage. But it could have a much smaller Share of Search in the decision-making stage. This could impact sales.
Search can only tell you about part of the customer journey. Brands can expand their understanding by analysing conversations on social media as well. This can provide real insights into barriers and drivers for potential buyers. As well as identifying areas to improve, it can help to prove the impact of PR and marketing activity.
Example of a Search in the Decision-Making Stage of the Customer Journey
[…] customers are searching for, you can help your website to rise through the ranks in Google, so you can capture a greater share of search. Increasing your visibility in organic searches also has the benefit of decreasing the need to […]